


.png)


Manufacturing is a highly competitive industry, and the road to success has been uphill for many businesses over the last several years.
Table of Contents
- Criteria for Manufacturing KPIs
- Operational Efficiency Metrics
- Cost-Related Metrics
- Delivery & Lead Time Metrics
- Safety & Compliance Metrics
- Employee Productivity Metrics
- Technology & Metrics
- Final Thoughts
Plagued by material shortages, rising costs, and a collapsing supply chain, manufacturers are facing new challenges and learning how to navigate those challenges in real-time.
According to a survey conducted by Deloitte, 72% of executives believe these challenges will remain the biggest uncertainty facing the industry in the years to come.
One way organizations mitigate risk is by implementing technology in the right places, including using technology to track specific key performance indicators or KPIs.

KPIs are measurable metrics used to assess progress toward a specific goal. In a manufacturing setting, KPIs assess the performance of specific processes.
These metrics help organizations visualize and understand how quality directly affects results and determine what steps they should take to improve the overall performance of operations.
This article will examine some of the most helpful manufacturing KPIs and metrics. It will also explain why these KPIs can make such a huge difference in quality, productivity, cost mitigation, and even employee performance.
Criteria for Manufacturing KPIs
Every business is different, and so every business objective is different. The great thing about KPIs is that organizations can use them to gain visibility and understanding of virtually every process within a facility.
This flexibility makes using KPIs extremely beneficial. However, too much data and information can become overwhelming for team members.
Choosing where to implement KPIs and for what reason needs to be strategic, and the goal should always be to make improvements in specific areas.
With that in mind, here are some considerations for choosing manufacturing KPIs that align with business goals.
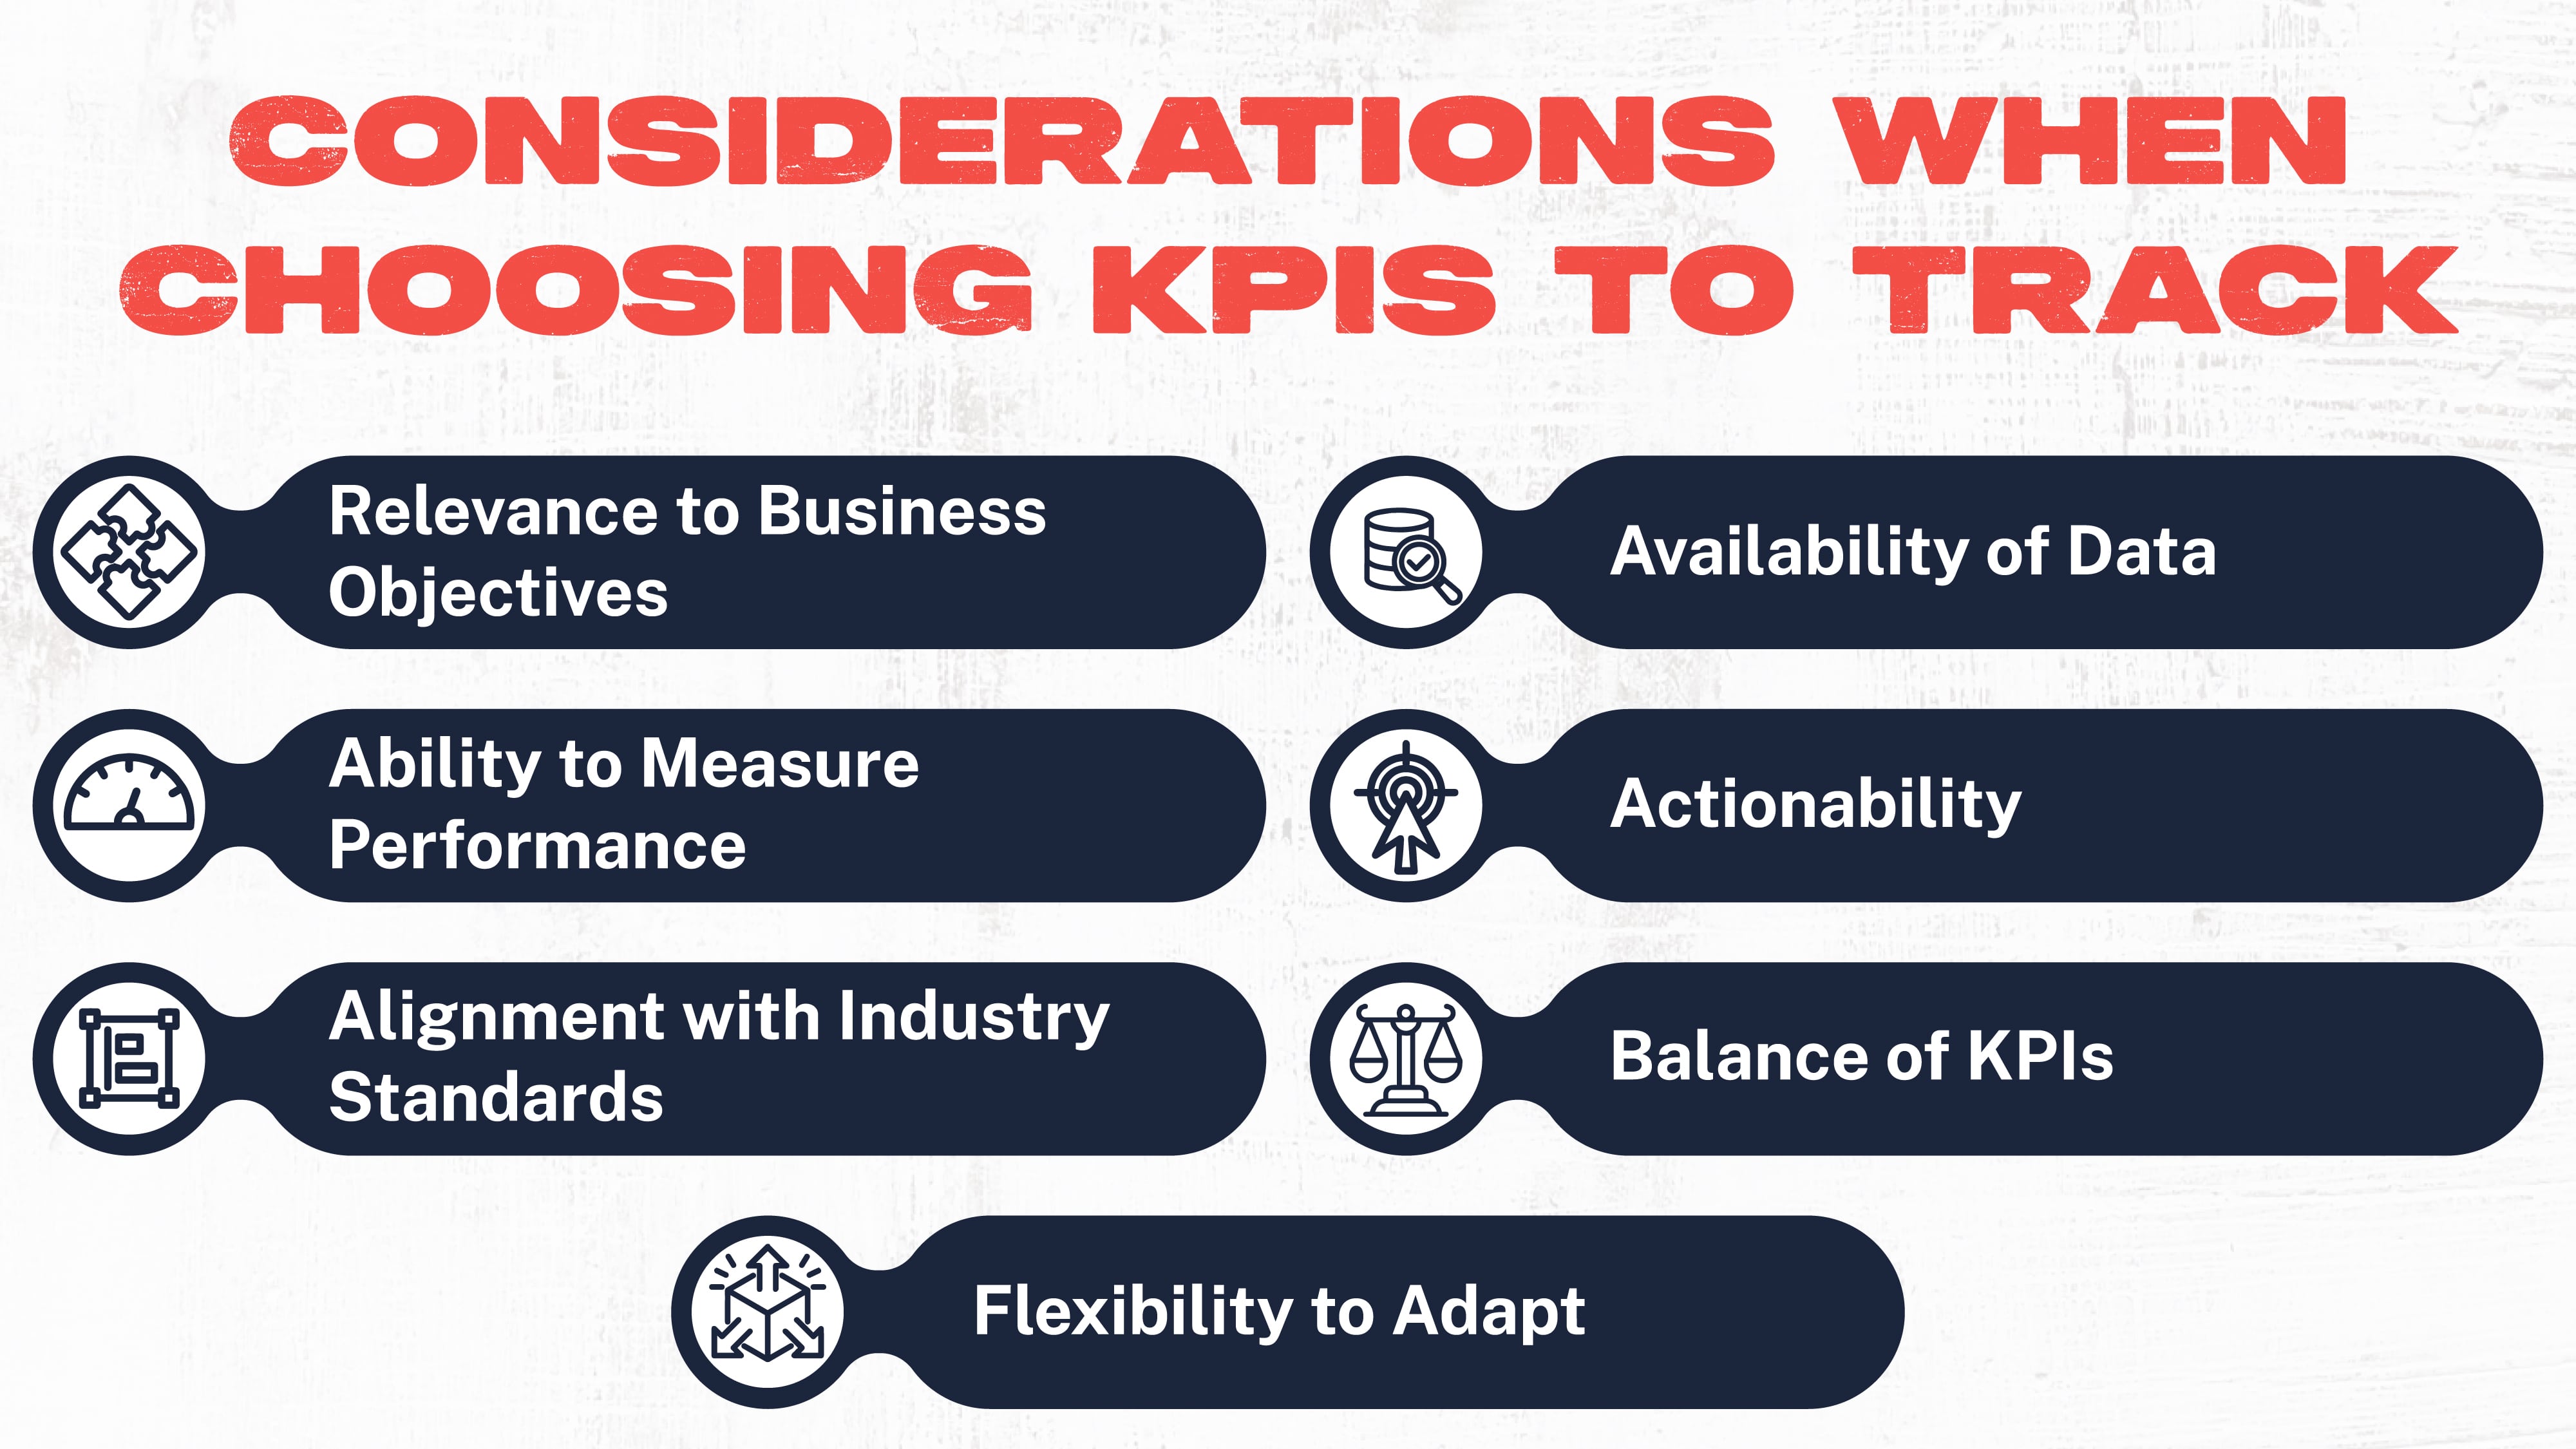
Relevance to Business Objectives – Every KPI should be aligned with a specific goal. Outlining goals related to productivity, quality, cost reduction, or customer satisfaction is the first and most important step in choosing effective KPIs.
Ability to Measure Performance – KPIs should be based on measurable data and outcomes. The specificity used in determining goals should also be applied to these measurables. The data obtained using KPIs should be clear and actionable.
Alignment with Industry Standards – Research what the industry is doing to help determine which KPIs would be most effective in reaching specific goals. Delve into common benchmarks and best practices to learn from others' experiences and avoid similar mistakes.
Availability of Data – KPIs are only as good as the data used during the process. Assess the availability and accessibility of the data required to measure the chosen KPIs accurately.
Decide whether there are already systems to collect the data or whether investments in technology or operations might be necessary to facilitate data collection in the right areas.
Actionability – The goal of setting KPIs is to make specific improvements. The choice of KPIs should consider whether they provide actionable insights that can lead to those improvements. Look for KPIs that will drive meaningful changes in your manufacturing processes.
Balance of KPIs – While KPIs are designed to tackle specific goals, you should look for a balance in your overall choices. A balanced set of KPIs that cover the most vital aspects of your manufacturing process will have the greatest effect.
Flexibility to Adapt – The only constant in business is change. Therefore, it will benefit the organization in the long run to understand that business objectives and priorities may morph over time. Look for KPIs that are flexible enough to adapt to those changes.
Operational Efficiency Metrics
One of the most useful and essential manufacturing KPIs relates to Operational Efficiency.
Overall Equipment Efficiency (OEE) is a calculation organizations can use to determine how efficiently they use resources, including equipment, and how productive they are overall. It helps organizations pinpoint areas where productivity and efficiency are lacking.
That might seem like a vague definition, and that might be the case. But the ability to gain a big-picture perspective into individual processes makes OEE so beneficial.
![]()
Tracking OEE can help manufacturers in numerous ways, such as:
Performance
OEE breaks down production into three categories: availability, performance, and quality.
In other words, it measures how often a piece of equipment is operating compared to how often it’s scheduled to operate, considers the overall performance and efficiency of the process, and measures the quality of the output.
Losses in any of these three areas will be highlighted by a low OEE and present an opportunity for improvement.
Insight into Production Efficiency
Ask a manufacturer to measure the performance of their production processes without using specific data points, and you will probably get an answer that inflates the truth.
Many organizations overestimate their process efficiency. Tracking OEE gives them better insight into the reality of the matter and helps them see exactly where productivity and efficiency are suffering and why.
Competitiveness
Success in manufacturing is a careful balance between cost and profit. The manufacturing industry faces astronomical costs when you consider the totality of the expense of production.
Tracking OEE can help manufacturers make the most of their budget by reducing the cost of production without sacrificing quality.
Customers benefit from high-quality, affordable products delivered quickly, and the organization benefits from remaining competitive in a tight market.
Reduced Machinery Cost
OEE also helps manufacturers identify issues that represent a red flag regarding upcoming maintenance or breakdowns.
By tracking the efficiency of a process in real-time, manufacturers can spot potential problems before they snowball and prevent significant maintenance issues before they occur.
Return on Investment
Another perk of OEE is its usefulness in boosting ROI or return on investment.
Machinery and equipment represent a significant cost, and OEE calculations help organizations compare performance before and after adding new equipment. It also helps ensure that new machinery is utilized to its full potential.
Quality Metrics
Perhaps the most vital metrics when it comes to manufacturing KPIs relate to quality.
After all, quality is likely one of the biggest requirements of customers, and customers are the ones paying the bills.
There are three common quality centric KPIs that manufacturers can use to keep tabs on the quality of their products. They are Overall Yield, First-Pass Yield, and Supplier Defect Rate.
Together, these three KPIs help organizations measure the total quality of their output, the quality of the materials coming in through suppliers, and the frequency of defects or errors coming off the line.
What is obtained is a clear picture of the quality and efficiency of production, which manufacturers can use to identify areas that need improvement.
Yield
Yield is one of the most common metrics that manufacturing facilities track. It can be measured in two ways: First Pass Yield (FPY) and Overall Yield.
● First Pass Yield (FPY)
FPY is a measurement that tracks the percentage of items coming off the line that are ready for sale. In other words, it measures products that meet quality standards and do not need rework.

A high FYP means processes and machinery are operating as expected and the output meets industry, facility, and customer standards. A facility with a high FYP is producing consistently high-quality products.
● Overall Yield
Overall Yield is a similar measurement to FPY, except it also accounts for products that meet quality standards but still require rework. A high yield demonstrates efficiency and helps organizations keep track of their waste as well as the quality of their output.
Supplier Defect Rate
The quality of the final product is a combination of the quality of the processes and the materials used. Tracking the Supplier Defect Rate effectively measures the percentage of materials received from suppliers that do not meet quality standards.
Organizations should track the Supplier Defect Rate for each supplier and look for alternative sources if a particular supplier consistently delivers materials that fall below standards.
Cost-Related Metrics
Another important factor for manufacturers is the cost of operations. Keeping costs low by optimizing efficiency and reducing losses allows organizations to pass those savings along to customers, maintain a competitive edge, and still make a profit.
Manufacturing KPIs related to cost can be broken down into three commonly used measurements: Cost of Goods Sold (COGS), Total Cost of Ownership (TCO), and Yield Loss or Scrap Rate.
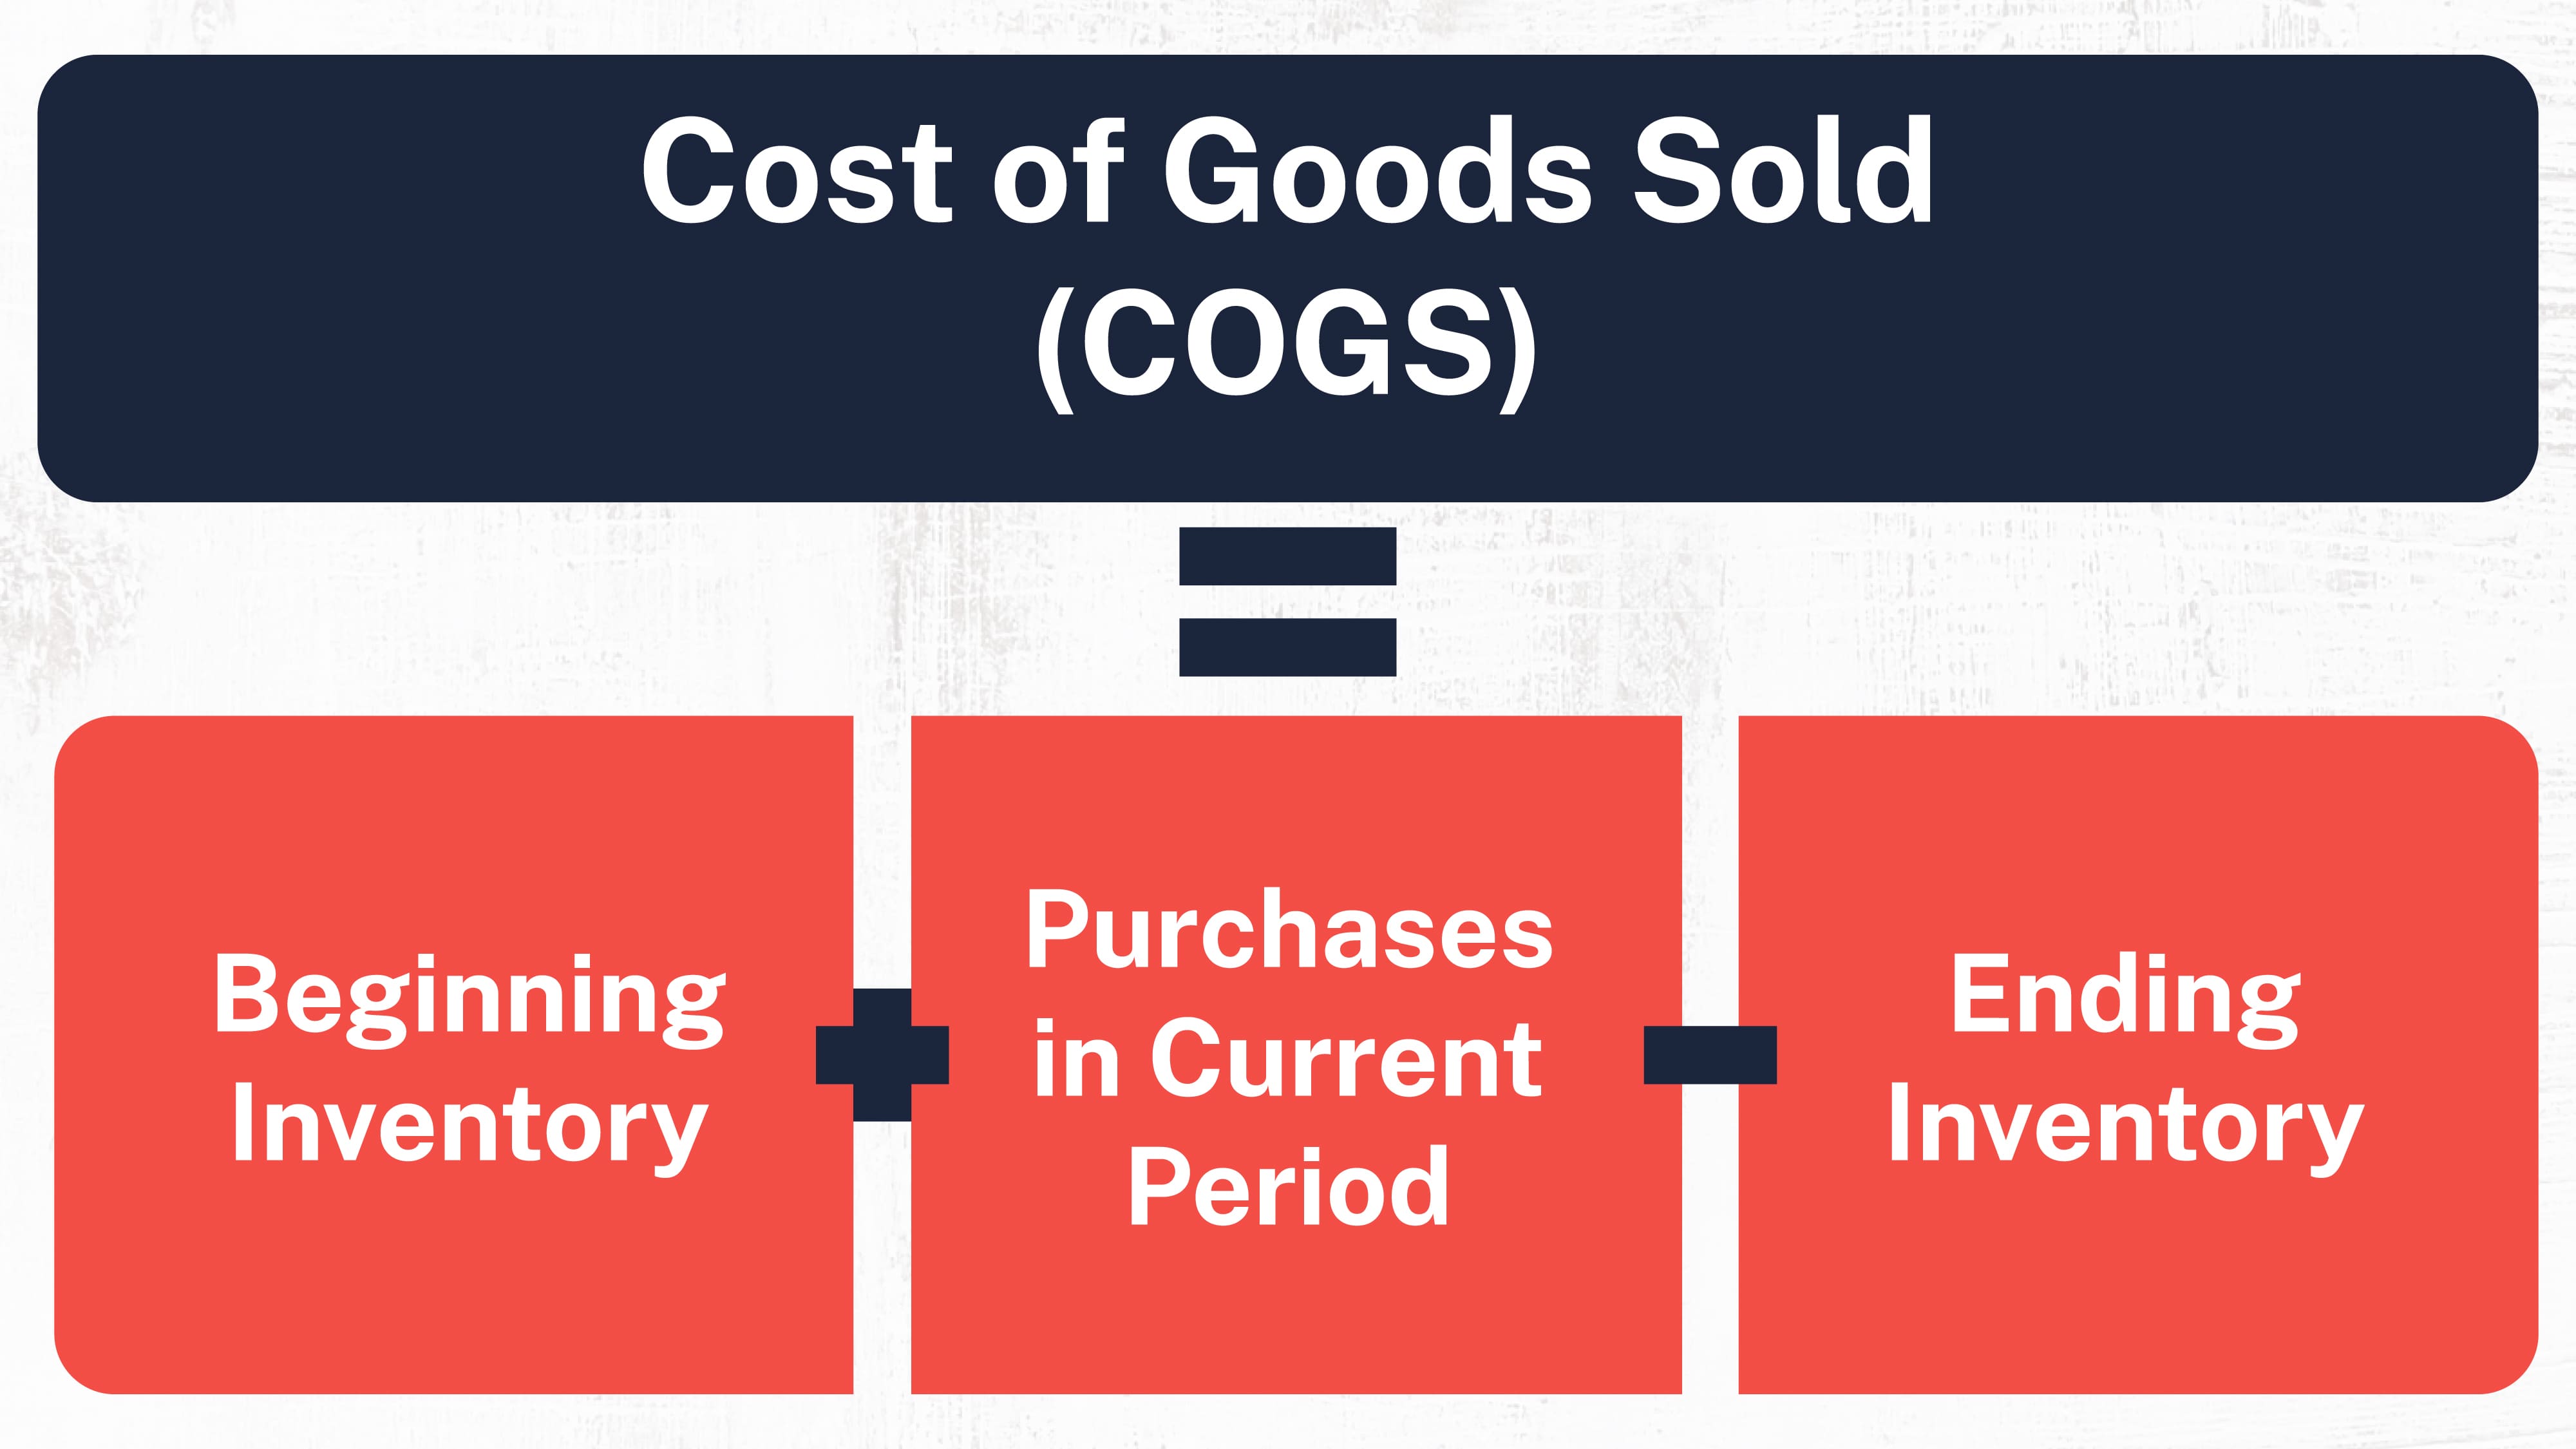
Cost of Goods Sold (COGS)
Cost of Goods Sold, or COGS, is a measurement of the direct cost of production, including things like materials and labor.
This measurement does not include indirect costs related to distribution, marketing, and sales. Instead, COGS is a metric that allows organizations to calculate gross profit margin and determine their bottom line accurately.
Total Cost of Ownership (TCO)
Total Cost of Ownership, or TCO, measures the total cost of a piece of equipment or machinery across its lifetime.
Instead of focusing on the purchase price alone, TCO considers the cost of implementing, using, and even disposing of a piece of equipment once it has reached the end of its lifecycle.
It provides an accurate measurement of cost versus return on investment.
Yield Loss or Scrap Rate
The Scrap Rate measures the percentage of products with defects or errors that cannot be reworked and result in waste. When a product falls below standards to the point where it is unacceptable or unsafe for consumers, it is considered scrap waste.
Tracking this KPI in addition to FPY and Overall Yield provides a clear picture of the efficiency and quality of the process.
Delivery & Lead Time Metrics
A product is only worth its value if it reaches a customer on time. Getting a product to the customer quickly and efficiently is critical to the ongoing success of a manufacturing organization. That’s why two of the most useful manufacturing KPIs relate to delivery and lead time.
The time it takes to deliver an order to a customer combines the time required to produce the product and the time spent on delivery. On-time delivery (OTD) and Order Lead Time provide insights into these metrics' efficiency.
On-Time Delivery (OTD)
Getting orders to customers promptly helps instill trust in the customer, increases customer loyalty, and promotes a reputation of reliability – all things that customers expect from manufacturers. On-Time Delivery, or OTD, is a KPI that organizations can use to determine how well they fulfill this expectation.
Failure to provide quick, accurate, and reliable delivery will have the opposite effect. Customers will lose trust, the company’s reputation will suffer, and long-term success will become difficult to maintain.
Order Lead Time
Order Lead Time is a measurement of the time elapsed from when an order is placed until that order is completed. Many factors can affect order lead time, such as planning, scheduling, production and processing, and unexpected wait times.
The best way to optimize order lead time is to be fully aware of it, which this KPI provides for manufacturers.
Considering every roadblock in production and understanding how those roadblocks extend order lead time can help organizations avoid those situations in the future.
Effectively managing order lead time requires careful planning, production scheduling, and proper maintenance procedures.
This helps manufacturers improve their overall efficiency, reduce customer wait times, optimize inventory management, and better use operational resources.
Safety & Compliance Metrics
Focusing on productivity, customer satisfaction, and cost versus profit is essential for any manufacturer hoping to stay afloat. However, every manufacturer understands these objectives must be met without sacrificing safety.
The government and regulatory bodies play their part by putting strict rules and regulations in place that monitor and measure the safety and compliance of manufacturers.
While these regulations may differ depending on the specific industry, one over-arching truth is this: Manufacturers who fail to consistently provide a safe environment for workers, customers, and the planet will face steep penalties and fines. And they might even find themselves out of business.
Manufacturing KPIs centered around safety and compliance measures include Lost Time Injury Frequency Rate (LTIFR) and KPIs designed to measure the effectiveness of environmental control systems.
Lost Time Injury Frequency Rate (LTIFR)
Lost Time Injury Frequency Rate, or LTIFR measures the frequency of workplace-related injuries that result in lost workdays. Tracking this metric allows organizations to assess their overall safety performance.
Understanding how often employees are missing work due to workplace-related accidents or injuries can help companies find areas where improvements will make a difference and implement strategies to help the organization improve.
According to the Bureau of Labor Statistics, the manufacturing sector experiences the highest percentage of work-related injuries of any industry, with 64,640 workers missing at least one day of work in 2019.

Environmental Compliance Monitoring
Manufacturers have a responsibility, both legally and ethically, to comply with all environmental and regulatory requirements that pertain to their specific industry.
And keeping the government happy isn’t the only reason to do so, because today’s consumer demands ecologically and environmentally friendly companies.
Tracking environmental compliance effectively requires the implementation of an environmental management system.
These systems provide ongoing ecological compliance assessments, air emissions monitoring, waste and hazardous waste management, and water quality monitoring.
Employee Productivity Metrics
Another component included in the cost of production is labor. Building a competent, reliable, and highly productive workforce is an essential manufacturing requirement.
There are numerous manufacturing KPIs related to employee productivity that organizations can use to gain perspective, including labor productivity, tracking training hours and skill development, participant satisfaction, and more.
Labor Productivity
Labor Productivity is a measurement calculated by dividing the total output, or units produced, by the total labor hours worked. This metric is crucial and helps manufacturers understand how efficient and productive their labor force is.
It provides insight into how effectively a company is utilizing its workforce. It also allows for assessing where improvements can be made or where shortfalls are occurring.
Employee Evaluation Metrics
There is a wide range of KPIs that organizations can use to track the progress and performance of their workforce.
Smart organizations understand that these measurements should start with the training programs because workers are only as good as their training. Ineffective and poorly executed training will result in poorly trained, unproductive, and unsafe workers.
Considering that the U.S. alone spent $42.4 billion on employee training and education in 2020, it makes sense that organizations should take steps to ensure they’re making the most of that investment.

Tracking metrics like participant satisfaction and learning outcomes provides an understanding of the effectiveness of training programs and highlights areas where changes are necessary.
Post-training, organizations can track performance improvements and behavior changes to judge the success of learning initiatives.
Organizations can measure these things in various ways, including post-training quizzes, surveys, case studies, and certification exams.
Technology & Metrics
The manufacturing industry has always been driven by innovation and technology. That fact is only becoming more relevant as organizations look for ways advanced technology and data can make a huge difference in operations and productivity.
One way is tracking manufacturing KPIs that measure efficiency, productivity, and downtime.
Instead of relying on manual tracking methods, companies are turning to technology to increase the effectiveness and accuracy of these metrics.
Tracking Machine Downtime and Overall Labor Efficiency are much more accurate and useful with automated data collection and analysis tools.
Let’s look at these two metrics and how technology is making it easier than ever for organizations to use them.
Machine Downtime
Downtime is a productivity killer; tracking it is essential for organizations. It provides an easy way to identify the causes of machine failures and assess the impact on overall production.
Technology allows organizations the ability to track data in real-time, giving them increased visibility and better-informed decisions. The result is a better ability to mitigate the risk, minimize downtime, and increase productivity.
Overall Labor Efficiency (OLE)
Overall Labor Efficiency is calculated by combining the utilization percentage (based on standard activity hours and total productive hours) with an employee's productivity percentage. The result is an accurate measurement of overall labor effectiveness.
OLE provides insight into how well an organization utilizes its workforce, the employees' performance, and the output's quality. Combined, these provide a clear picture of how the performance and productivity of the workforce affect overall production.
Final Thoughts
The only way to quantify progress is to measure it. Thanks to the slew of manufacturing KPIs to choose from, organizations can gain incredible insight into the efficiency of their operations, the safety of their work environment, and the overall productivity of their processes.
Thanks to the inclusion of automated data-capturing technology and systems, manufacturers have gained an advantage never seen in these efforts.
Access to real-time data allows organizations to quickly analyze and assess information, make immediate observations, and implement strategies that solve problems quickly.
KPIs provide valuable insight into real-time product quality, allowing managers and decision-makers to address quality issues on the fly.
By implementing advanced Quality Management Systems, organizations can receive accurate and reliable KPIs that integrate with factory automation systems.
QMS systems collect and deliver KPIs in real-time, delivering reliable and precise data that can be rapidly analyzed with solutions faster than human capabilities allow.
Continuous improvement is an ideal that manufacturers should strive for if they want to remain competitive in the market. Tracking the most common manufacturing KPIs allows organizations to maintain that goal of constantly seeking ways to do better and be better.
Written by Dozuki
Dozuki is the leading Connected Worker Platform for industrial operations. Since 2011, Dozuki has helped thousands of manufacturing sites standardize processes, upskill their workforce, and capture real-time data to drive continuous improvement. With a focus on ease of use and enterprise-grade security, Dozuki is the...